Figure 1.
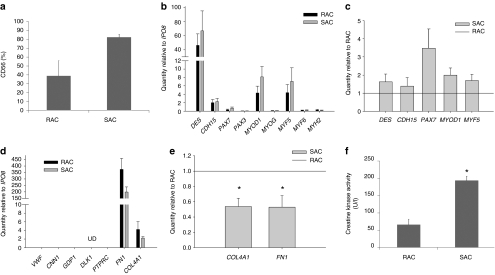
Characterization of the RAC and SAC after culture expansion. (a) Each cell population was analyzed for myogenic purity by CD56 flow cytometry. (b) Myogenic gene expression profiles were measured in the RAC and SAC populations. Gene expression values are relative to the endogenous control gene IPO8. (c) SAC populations demonstrated increased expression of all expressed myogenic genes relative to the RAC populations. (d) Detection of other cell types within the RAC and SAC populations: VWF for endothelial cells, CNN1 for smooth muscle cells, GPD1 for adipocytes, DLK1 for preadipocytes (UD, undetectable), PTPRC for blood cells, and FN1 and COL4A1 for fibroblasts. (e) SAC populations displayed decreased expression of FN1 and COL4A1 relative to the RAC populations (*P < 0.05). (f) SAC populations more rapidly differentiated into multi-nucleated myotubes than the RAC populations as signified by increased creatine kinase activity (*P < 0.05). RAC, rapidly adhering cell; SAC, slowly adhering cell.

