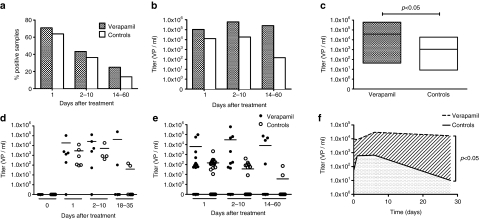
Figure 1.
Higher virus titers seen in serum of patients treated with verapamil. (a) Percentage of serum samples positive for oncolytic virus DNA as detected by quantitative PCR. (b) Maximum titers in serum samples within the indicated time interval after treatment. (c) Floating bars plot showing mean virus titers (horizontal line) in positive serum samples after treatment, with ranges (box). (d) Virus titers in serum during first cycles of oncolytic adenovirus treatments with (n = 6) and without (n = 6) verapamil. Horizontal line indicates mean. (e) Virus titers in serum after treatments (n = 30+30) of patients who had received prior adenovirus treatments. (f) Mean virus titers of all samples at each time point plotted at respective time points (median of sample days) for illustration of area under the curve analysis.

