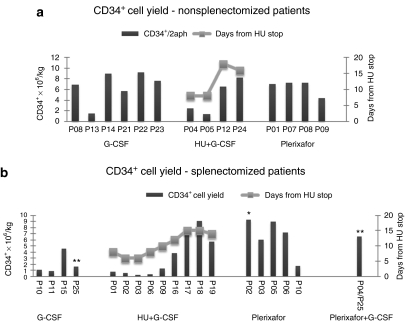
Figure 1.
CD34+ cell yield. (a) Non-SPL patients. The yields from non-SPL subjects, in total 2 aphereses, are shown individually in bars. Left panel: G-CSF-treated subjects; middle panel: HU+G-CSF-treated subjects; right panel: plerixafor-treated subjects. The mobilization outcome in the HU+G-CSF-treated group is directly correlated with the length of the washout period after HU (gray line). (b) SPL patients. The yields from SPL subjects, in total 2 aphereses, are shown individually in bars. Left panel: G-CSF-treated subjects; left-middle panel: HU+G-CSF-treated subjects; right-middle panel: Plerixafor-treated subjects; right panel: Plerixafor+G-CSF-treated subject. The mobilization outcome in the HU+G-CSF-treated group is directly correlated with the length of the washout period after HU (gray line). The primary y-axis represents the CD34+ cell yield ×106/kg and the secondary y-axis the days of washout period after HU-pretreatment. P25 and P04/P25 (**) is the same patient mobilized initially with G-CSF and later with Plerixafor+G-CSF. Patients P02 (*) and P04/P25 (**) reached the target cell dose in 1 apheresis. G-CSF, granulocyte-colony stimulating factor; HU, hydroxyurea; non-SPL, nonsplenectomized; SPL, splenectomized.

