Figure 2.
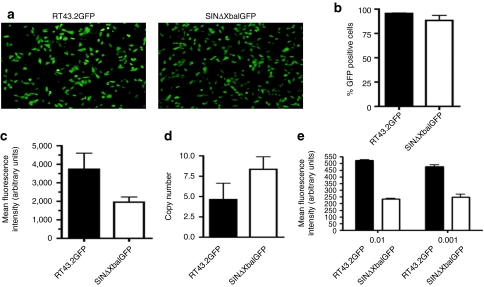
GFP expression in cells exposed to MLV-based SIN vectors and proviral copy number. (a) Representative fluorescence microscopy images of GFP expression of MDTF cells exposed to RT43.2GFP vectors (left panel) and SINΔXbaIGFP vectors (right panel). (b) Percent GFP positive MDTF cells exposed to RT43.2GFP or SINΔXbaIGFP vectors as measured by flow cytometry. (c) MFI of MDTF cells exposed to RT43.2GFP or SINΔXbaIGFP vectors as measured by flow cytometry. (d) Proviral integrant copy number. Genomic DNA was extracted from MDTF cells exposed to RT43.2GFP or SINΔXbaIGFP vectors. GFP specific primers were used to determine the copy number of vectors per cell with qPCR. (e) RT43.2GFP or SINΔXbaIGFP vectors were each diluted to 100 (shown as 0.01) and 1,000-fold (shown as 0.001) and then applied to MDTF cells. GFP expression was measured using MFI as an index. All results are depicted as mean ± SEM, n = 3. GFP, green fluorescent protein; MDTF, Mus dunni tail fibroblast; MFI, mean fluorescence intensity; MLV, murine leukemia virus; qPCR, quantitative PCR; SIN vectors, self-inactivating vectors.

