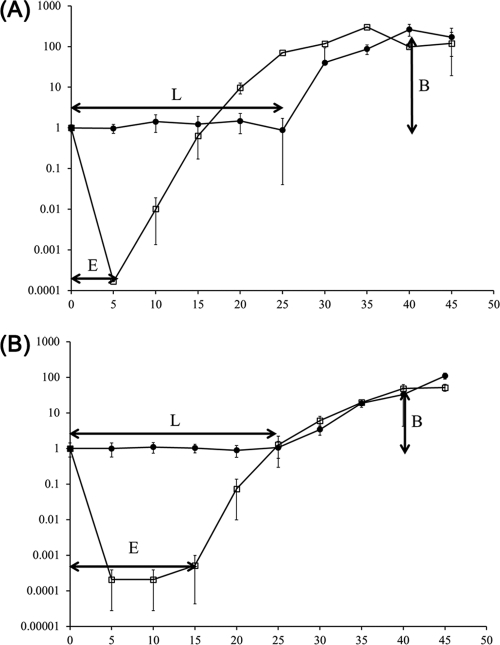
Fig 2.
One-step growth curve analysis of S. Typhimurium SL1344 (A) and E. coli O157:H7 ATCC 43890 (B) infected by SFP10 phage. E, eclipse period; L, latent period; B, burst size. Closed circles, non-chloroform-treated sample; open squares, chloroform-treated sample. The error bars indicate standard deviations.

