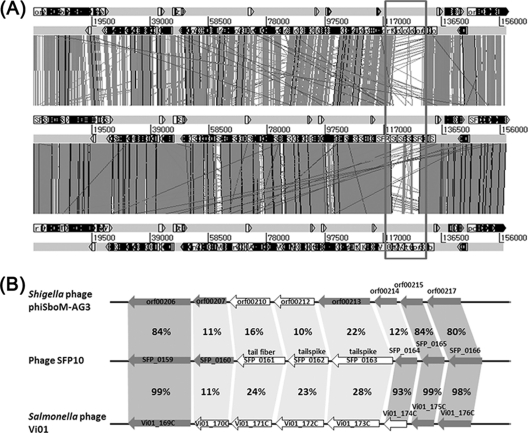
Fig 7.
Comparative analysis of three phage genomes (A) and gene clusters involved in host specificity for infection from three phage genomes (B). (A) Phage SFP10 (middle), Shigella phiSboM-AG3 phage (top), and Salmonella phage Vi01 (bottom). The variable regions in the three phage genomes involved in host specificity for infection are boxed. (B) The white arrows indicate host specificity genes, and the gray arrows indicate hypothetical proteins. The identities of amino acids between homologous genes are indicated as percentages.

