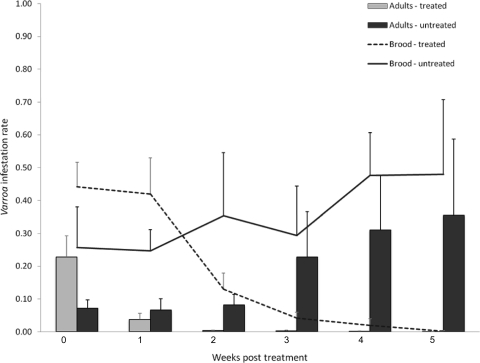
Fig 2.
Colony level mite infestation rates for adult bees represented in a histogram for the treated and untreated colonies, along with a line graph indicating the brood mite infestation rates for treated and untreated colonies through the duration of the experiment. Samples were taken weekly, with the first sample taken just prior to administering the acaricide treatment to the treated group, identified as week 0. Treated colonies at weeks 4 and 5 are represented by only 1 colony where mites were still present. The error bars denote standard errors.

