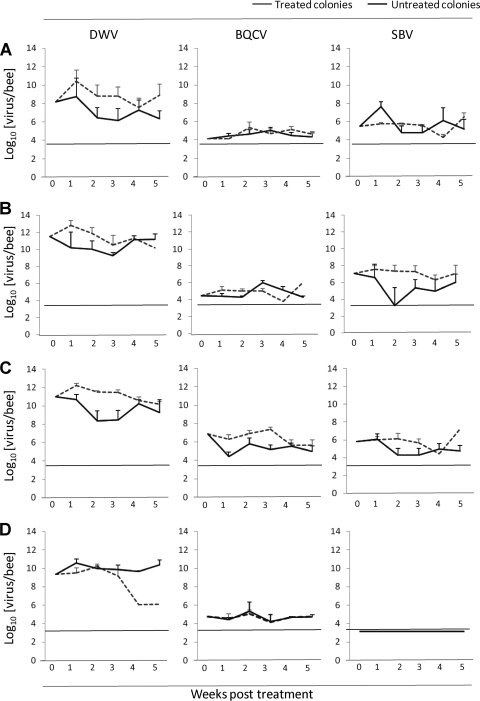
Fig 3.
Pretreatment-normalized DWV, BQCV, and SBV titers of uninfested pupae (A), infested pupae (B), adult bees (C), or Varroa mites (D) in treated colonies and untreated colonies for the duration of the acaricide treatment. Week 0 represents the pretreatment sample, and the titers in infested pupae and Varroa mites in treated colonies at weeks 4 and 5 are represented by only 1 colony where mites were still present. The titers are given on a log10 scale, and the dotted lines indicate the limit of detection of the RT-qPCR assays. The error bars denote standard errors.

