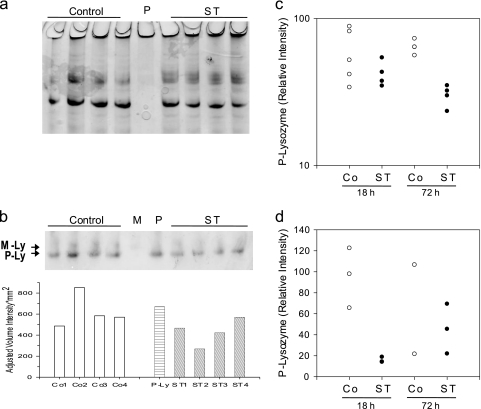
Fig 2.
Reduction of P lysozyme in ST-infected mice. (a) Representative Coomassie blue-stained AU-PAGE from small-intestinal tissue protein extracts (12 μg/lane) 72 h after infection with ST or inoculation with PBS (control). Shown are extracts from four individual mice in each group. P, small-intestinal mucosal crypt extract (2.5 μg). (b) Western immunoblot with protein extract from the same mice (4.5 μg/lane, top) and corresponding intensity data for P lysozyme (bottom). M, neutrophil extract (1 μg) containing M lysozyme; P, same as described for panel a. Arrows point to M lysozyme (M-Ly) and P lysozyme (P-Ly). (c and d) Relative intensities for P lysozyme from two different animal experiments (n = 4 for panel c with the exception of Co 18 h, where n = 5; n = 3 for panel d, with the exception for ST 18 h where n = 2). The representative image shown in panel b is from the experiment whose results are shown in panel c. The data are expressed as relative P lysozyme intensities (test band intensity divided by intensity obtained from P lysozyme standard × 100). Shown are the averages of triplicate determinations of relative P lysozyme intensities from individual mice. Univariate two-factor ANOVAs of relative intensity show no significant differences due to time (18 h versus 72 h) and no significant interaction between time period and treatment for both experiments; however, there were significant differences between the control and ST groups, with P = 0.003 for the experiment shown in panel c and P = 0.033 for the experiment shown in panel d.

