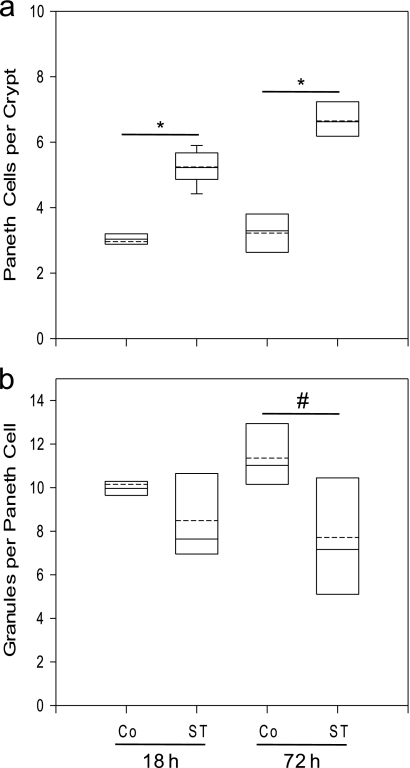
Fig 4.
Increased Paneth cell numbers per crypt and decrease of granules per Paneth cell in ST-infected mice. Small-intestinal tissue sections were removed 18 and 72 h after infection with ST or inoculation with PBS (Co, control), formalin fixed, and H&E stained. Forty well-preserved crypts each were evaluated in two different sections for each mouse. (a) Paneth cell numbers per crypt; (b) granules per Paneth cell. The data are represented in box plots showing the 25th percentile closest to zero and the 75th percentile farthest from zero. The solid line within the box represents the median, and the dashed line represents the mean (n = 3). Error bars above and below represent the 90th and 10th percentiles, respectively, of each group. *, P < 0.0005; #, P = 0.003.

