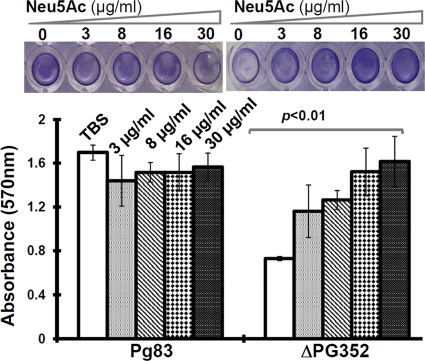
Fig 7.
Biofilm formation of Pg83 and the ΔPG352 mutant. The assay was carried out in 96-well microtiter plates as previously described (24, 46). The upper panel shows representative wells of Pg83 and the ΔPG352 mutant, and the lower panel gives the average absorbances of Pg83 and the mutant. The error bars represent the standard deviation. The numbers represent the concentration of Neu5Ac in the medium. The data were statistically analyzed by one-way ANOVA, followed by Tukey's multiple comparison at P < 0.01.

