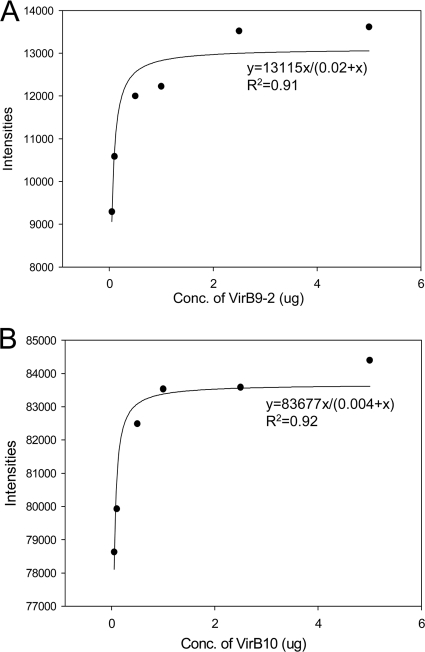
Fig 5.
Single site saturation binding curves for the interactions of rVirB9-1 with rVirB9-2 and rVirB10. Densitometry analysis was performed to evaluate the interactions of rVirB9-1 with rVirB9-2 (A) and rVirB9-1 with rVirB10 (B) that were applied to dot blots at amounts up to 5 μg, allowed to interact with 10 μg of rVirB9-1, probed with rabbit anti-VirB9-1 antiserum, and developed. Reactions were compared to the density of the reaction of rVirB9-1 to negative control rMSA1. The data are graphically represented as concentration of the protein on the spot versus spot intensity, and the curve was fit to a single site binding curve to yield the binding association constant. The graphs are representative of three independent experiments.

