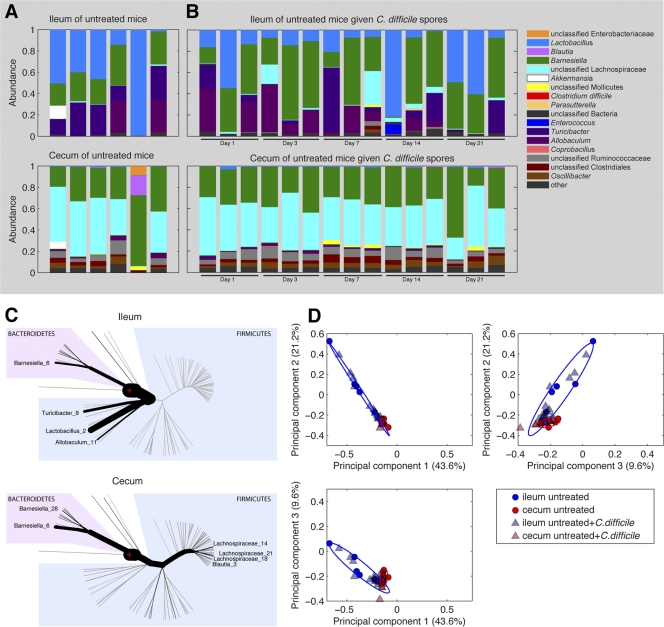
Fig 6.
Characteristics of the microbiota of the ileum and cecum of untreated mice. Phylogenetic classification of the 16S rRNA gene of the most predominant bacterial taxa in the ilea and ceca of untreated mice. (A) Each bar represents the microbiota of an individual mouse. (B) The relative abundances of major bacterial OTUs of the ilea and ceca of untreated mice administered 105 CFU of C. difficile spores on day 0 over the subsequent 21-day period are shown. (C) The relative abundance of major bacterial OTUs of untreated mice are given with reference to a phylogenetic tree. The thickness of branches corresponds to the relative abundance of the respective phylotypes. The number following phylotype name distinguishes different OTUs within the same genus. (D) PCA of ileal and cecal microbiota samples. Each point represents an individual mouse.

