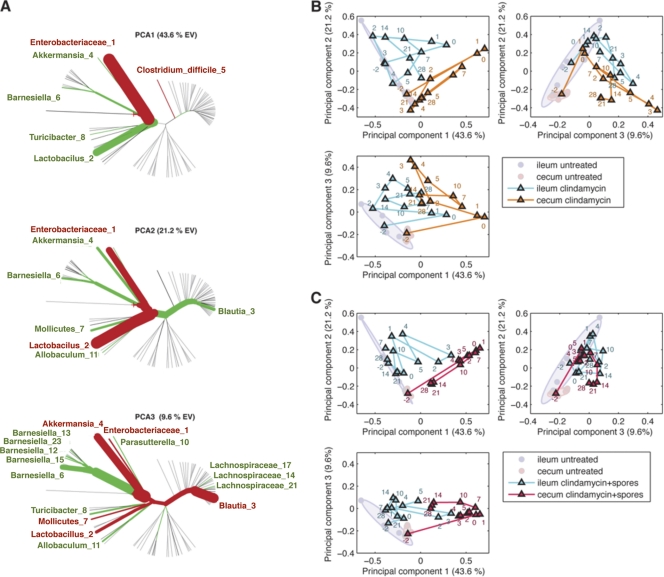
Fig 9.
PCA of the effect of clindamycin and C. difficile infection on the intestinal microbiota composition. (A) Principal components generated to explain maximal variance of samples from all treatment arms. The thickness of phylogenetic tree branches indicates the relative weight of that phylotype on the principal component. The color of branches indicates the sign of the phylotype (red, positive; green, negative). (B and C) Longitudinal principal coordinate analysis of cecal and ileal microbiota from mice treated with clindamycin (B) or clindamycin plus C. difficile spores (C). Untreated mice are represented as circles. Clindamycin was administered on day −1, and C. difficile spores were given on day 0. Each point represents the average of three separately housed mice. Number labels indicate the day (postinfection) on which the samples were harvested.

