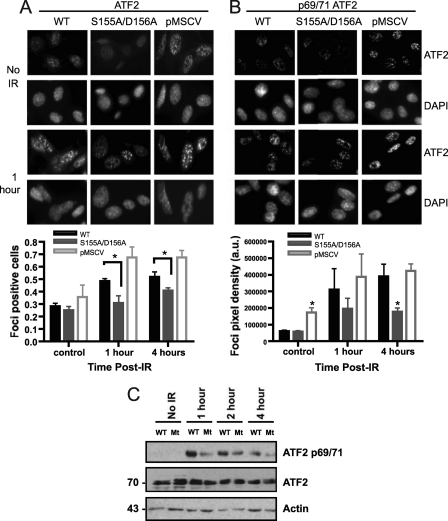
Fig 6.
Deficient ATF2 activation in response to DNA damage in Ku70 S155/D156-expressing cells. (A) Representative images of ATF2 focus formation in response to IR in Ku70−/− MEFs expressing wild-type Ku70 (WT), Ku70 S155A/D156A, and empty vector (pMSCV). Fixed cells either untreated (no IR) or 1 h after IR (6 Gy) treatment were stained with an ATF2 antibody and DAPI. The graphs show the quantification of focus formation done for unirradiated cells (control) or cells processed 1 or 4 h after IR treatment as described in Materials and Methods, and the results were averaged from four experiments (about 250 cells/experiments), with error bars representing SEM (∗, P < 0.05). (B) Cells were analyzed as described for panel A with a phospho-ATF2 (69/71) antibody. Representative images are shown at the top, with the quantification of phospho-ATF2 staining intensity from three separate experiments being shown below (a.u., arbitrary units of signal intensity). (C) Western blot analysis of phospho-ATF2 (69/71) in Ku70−/− MEFs expressing wild-type Ku70 (WT) and Ku70 S155A/D156A (Mt). Cells were left untreated (no IR) or were subjected to 10 Gy and collected at the time points indicated to prepare nuclear extracts. Western blot analysis was done with a phospho-ATF2 69/71 antibody (p69/71) or with an ATF2 antibody to determine total ATF2 protein and actin expression as indicated.

