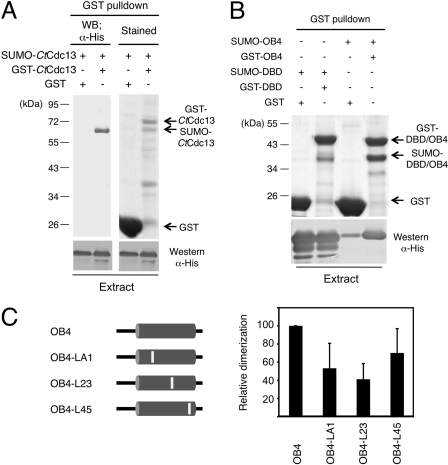
Fig 6.
Self-association of CtCdc13. (A) (Top) The indicated proteins were coexpressed and subjected to GST pulldown analysis. The bound proteins were analyzed by SDS-PAGE and either Coomassie staining or Western blotting (WB) using anti-His tag antibodies. (Bottom) The levels of His-tagged SUMO-Cdc13 protein in the input extracts were analyzed by Western blotting. (B) (Top) The indicated proteins were coexpressed and subjected to GST pulldown analysis. The glutathione-Sepharose-bound proteins were analyzed by SDS-PAGE and Coomassie staining. (Bottom) The levels of His-tagged SUMO fusion proteins (SUMO-DBD or SUMO-OB4) in the input extracts were analyzed by Western blotting. (C) GST pulldown assays were performed using either wild-type or mutated OB4 domains fused to the GST and SUMO tags. The ratio of the SUMO fusion to GST fusion protein in each precipitated sample was quantified, normalized to the wild-type sample, and then plotted. The results are from three independent experiments.

