Fig 5.
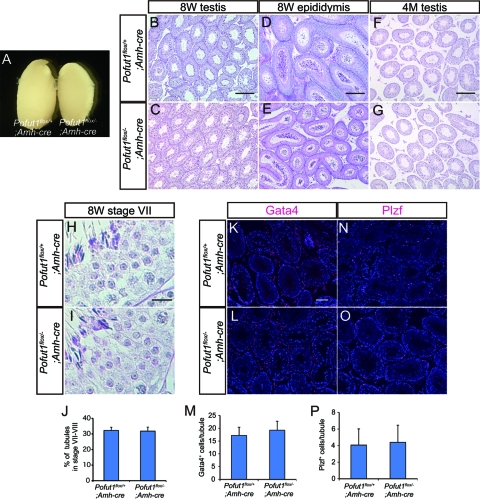
Spermatogenesis in Pofut1flox/−; Amh-cre mice. (A) Testes dissected from Pofut1flox/+; Amh-cre (left) and Pofut1flox/−; Amh-cre mice (right). (B to G) Histological sections of 8-week-old (8W) testes and epididymides and from 4-month-old (4M) testes obtained from Pofut1flox/+; Amh-cre and Pofut1flox/−; Amh-cre mice. (H and I) High-magnification image of spermatogenic cells in stage VII tubules obtained from Pofut1flox/+; Amh-cre and Pofut1flox/−; Amh-cre mice. (J) Proportion of stage VII to VIII tubules. (K to M) Distributions of Gata4-positive Sertoli cells (magenta) in Pofut1flox/+; Amh-cre (K) and Pofut1flox/−; Amh-cre (L) mice. The average numbers of Gata4-positive Sertoli cells in a seminiferous tubule are indicated in panel M. (N to P) Distributions of Plzf-positive spermatogonia (magenta) in Pofut1flox/+; Amh-cre (N) and Pofut1flox/−; Amh-cre (O) mice. The average numbers of Plzf-positive spermatogonia in a seminiferous tubule are indicated in panel P. Nuclei were stained with DAPI (blue). Error bars, standard deviations. Scale bars, 200 μm (B, D, and F), 20 μm (H), and 80 μm (K).

