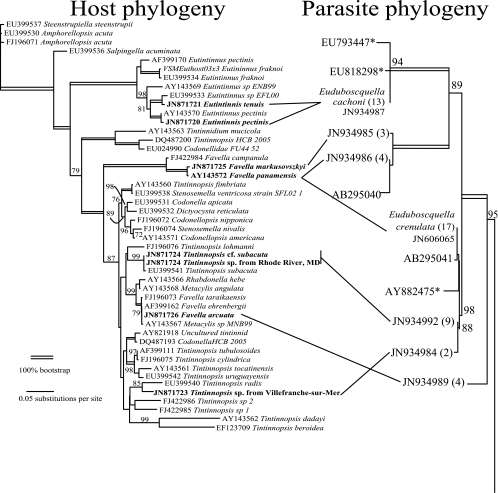
Fig 2.
Comparison of host and parasite SSU rRNA phylogenies. On the left, the maximum-likelihood phylogeny for the tintinnid hosts is shown, with the novel sequences in boldface type. On the right is a portion of the corresponding phylogeny for the parasite, showing only the Euduboscquella clade (see Fig. 3 for the complete phylogeny), with lines indicating the hosts. Next to the parasite accession numbers are the numbers of cells for which identical SSU sequences were determined. Bootstrap values are shown above the branches when greater than 70%.

