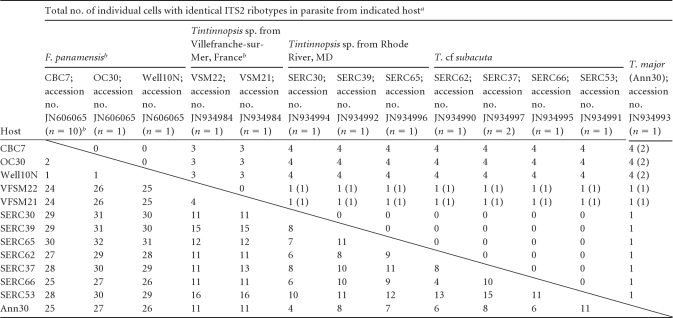
Table 3.
Compensatory and total nucleotide changes (above and below diagonal line, respectively) in the ITS2 region for a selected Euduboscquella clade
Compensatory and total nucleotide changes are shown above and below the diagonal line, respectively. Numbers in parentheses represent compensatory changes in the “stem” between 5.8S and LSU.
Single nonredundant sequences with ambiguous bases as needed were deposited in GenBank.

