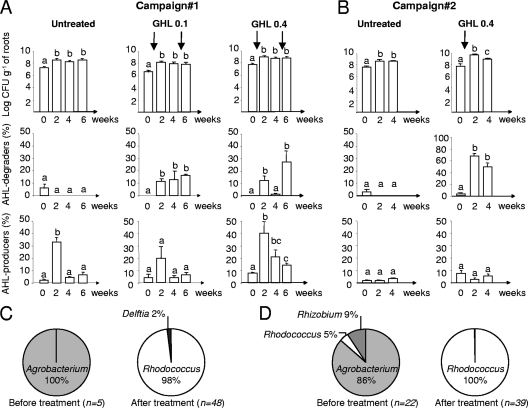
Fig 2.
Abundance and diversity of cultured AHL-degrading populations under GHL treatment. (A and B) Total cultured bacteria on TSA medium (CFU g [fresh weight] of roots−1), the percentage of AHL degraders, and the percentage of AHL producers were measured in untreated and GHL-treated (at 0.1 or 0.4 g liter−1) rhizospheres in the course of two independent campaigns; sampling was performed just before (time 0) and 2, 4, and 6 weeks after GHL treatment. In each histogram, all mean values were compared, and statistically significantly different values (Mann-Whitney, 0.05) are indicated by different letters. (C and D) Diversity of AHL degraders recovered from experiments 1 (C) and 2 (D) before and after GHL treatment. n, total number of rrs-identified isolates.

