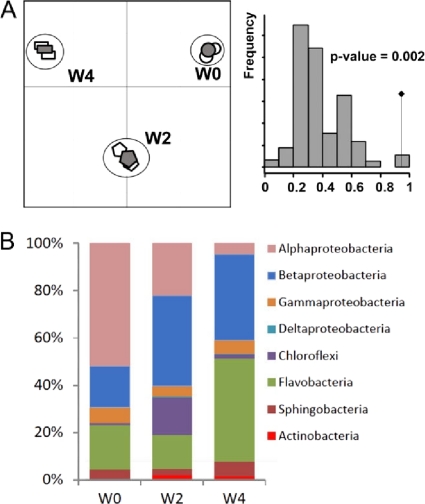
Fig 3.
Dynamics of bacterial diversity under GHL treatment revealed by rrs pyrosequencing. (A) (Left) Correspondence analysis of the two replicates (empty symbols) and merge data (filled symbols) in samples collected before treatment (W0) and 2 (W2) and 4 (W4) weeks after GHL treatment. (Right) Permutation test (n = 10,000) supporting correspondence analysis. The observed value is indicated by a black diamond. (B) Distribution of bacterial classes in merged W0, W2, and W4 data.

