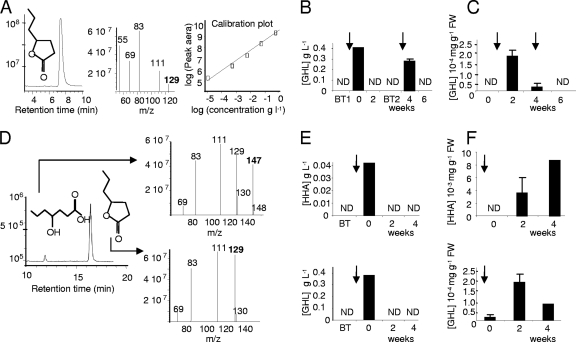
Fig 4.
Fate of GHL and its by-product HHA in GHL-treated plant cultures. (A to C) Quantification of GHL in experiment 1; (D to F) quantification GHL and HHA in experiment 2. (A) Pure GHL (M+H m/z of 129) was released after 7.3 min and used for preparing a calibration curve (GHL ranging from 1 g liter−1 to 0.01 mg liter−1). This curve was used to estimate the GHL concentration in nutritive solutions (B) and plant tissues (C). (D) Pure HHA (M+H m/z of 147) and GHL (M+H m/z of 129) showed retention times of 12.2 and 17.1 min, respectively, and were used for measuring two calibration curves. The concentrations of GHL and HHA were evaluated in nutritive solutions (E) and in plant tissues (F). In panels A and D, the signal intensity is expressed in arbitrary units; in panels B, C, E, and F, vertical arrows indicate GHL treatments at 0.4 g liter−1. All values are the mean of two replicates. ND, not detected.

