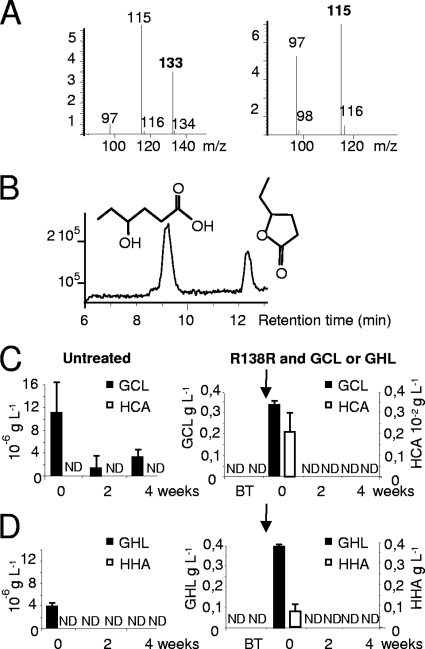
Fig 7.
Quantification of GCL, HCA, GHL, and HHA after combined treatments with R. erythropolis. (A and B) Pure GCL (M+H m/z of 115) and HCA (M+H m/z of 133) were released after retention times of 11.8 and 8.6 min (B), respectively, and used for measuring a calibration curve; the intensity of the signal is expressed in arbitrary units. (C and D) Concentrations of GCL, HCA, GHL, and HHA were measured in nutritive solution from untreated batches and those inoculated with strain R138R and treated with GCL (C) and GHL (D) at 0.4 g liter−1. Vertical arrows indicate introduction of strain R138R and GCL or GHL. ND, not detected.

