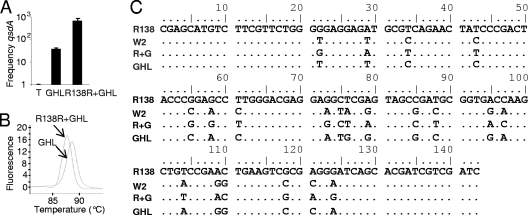
Fig 9.
Relative level of the qsdA gene of R. erythropolis. (A) The relative abundance of the qsdA gene after biostimulation with GHL and its combination with strain R138R was estimated by qPCR using the no-treatment control as a reference (arbitrarily set at 1). (B) Melting curve of the amplified qsdA fragments obtained from GHL-treated and GHL-R138R-treated samples. (C) Sequence alignment of the amplified fragments with the qsdA gene of R. erythropolis strains R138 and W2.

