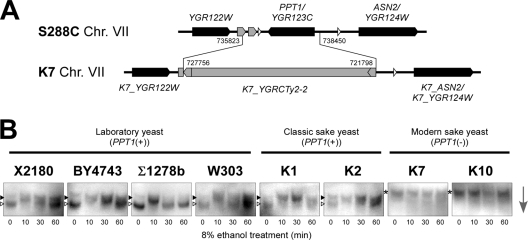
Fig 5.
Loss of PPT1 is related to the marked hyperphosphorylation of Hsf1p. (A) Schematic representation of the PPT1 locus in laboratory and sake strains revealed by whole-genome sequencing of K7 (1). Black, white, and gray symbols indicate ORFs, tRNA genes, and a retrotransposon and LTRs, respectively. Numbers indicate the chromosomal positions of gene replacement by a Ty2 element. (B) Phosphorylation states of Hsf1p under 8% ethanol stress conditions in the laboratory, classic sake, and modern sake strains. The same symbols as in Fig. 2 are used to indicate the phosphorylation states of Hsf1p, whose respective positions were determined by comparison with the control samples analyzed in the same gel. The arrow indicates the direction of electrophoretic migration.

