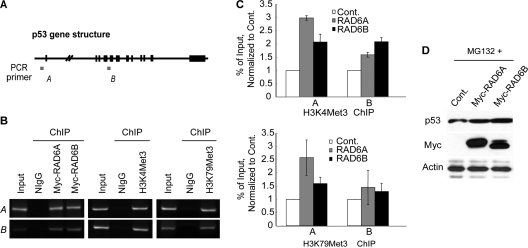
Fig 4.
RAD6 regulates the transcription of p53. (A) Gene structure of p53. This diagram was drawn according to the NCBI gene searching results. The sites used for the design of the primers for chromatin immunoprecipitation (ChIP) are indicated (regions labeled A and B). (B) RAD6, H3K4me3, and H3K79me3 are enriched at the promoter (panels A) and 5′ coding (panels B) regions of the p53 gene. HeLa cells were transfected with (left panels) or without (middle and right panels) RAD6. The ChIP analysis showed that RAD6, H3K4me3, and K79me3 were enriched at these p53 gene regions. (C) Overexpression of RAD6 increases the levels of H3K4me3 and K79me3 at the promoter (bars A) and 5′ coding (bars B) regions of the p53 gene in HeLa cells. HeLa cells were transfected with or without (Cont.) Myc-RAD6. The ChIP-qPCR analysis showed that the overexpression of RAD6 resulted in increased levels of H3K4me3 and H3K79me3 at these regions of the p53 gene. (D) RAD6 overexpression increases p53 protein levels following proteasome inhibition. HeLa cells were transfected with Myc control (Cont.) or Myc-RAD6 plasmids and treated with MG132 (25 μM) for 12 h. The anti-p53 antibody was used to visualize the amount of p53. The expression of Myc-RAD6 (Myc) is shown in the lower panel.

