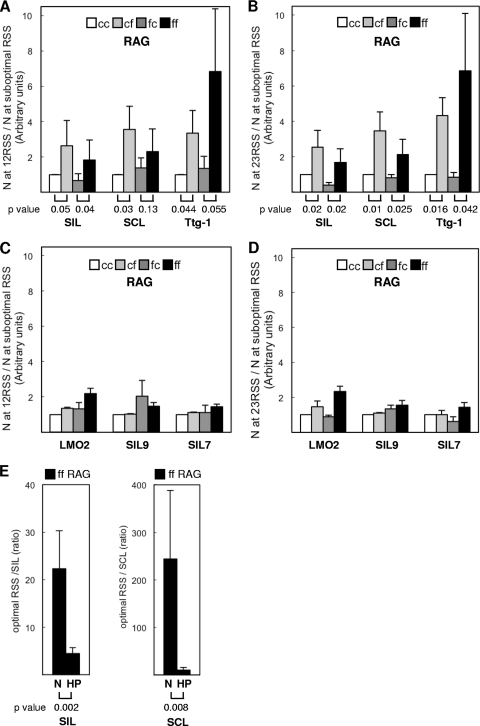
Fig 3.
RSS sequence discrimination by the RAG complex. (A) Histogram comparing the nicking efficiencies at an optimal RSS and suboptimal RSS by cc, cf, fc, or ff RAG complexes. Nicking at the 12RSS divided by nicking at the suboptimal RSS (y axis) was normalized to that of the cc RAG complex, which was arbitrarily set to 1. (There was wider variation in the yield of nicked product when Ttg-1 was used for the nicking assay, because the nicked products were very faint for Ttg-1 [Fig. 2B].) A one-tailed t test was carried out to test the hypothesis that the RAG complex with full-length RAG2 is capable of greater discrimination for signal sequence quality than is the complex containing core RAG2. The P values are listed under the histograms for the signal sequence discrimination by cc versus cf or by fc versus ff RAG complexes. (B) Histogram comparing the nicking efficiencies at an optimal RSS and suboptimal RSS. Nicking at the 23RSS divided by nicking at the suboptimal RSS (y axis) was normalized to that of the cc RAG complex, which was arbitrarily set to 1. As in panel A, the P values from the t test are listed under the histograms for signal sequence discrimination by cc versus cf or for fc versus ff RAG complexes. (C) Histogram comparing the nicking efficiencies at the optimal RSS and suboptimal RSS by cc, cf, fc, or ff RAG1 or RAG2 complexes. Nicking at 12RSS divided by nicking at the suboptimal RSS (y axis) was normalized to that of the cc RAG complex, which was arbitrarily set to 1. The P values from a t test for the data were substantially greater than 0.1. (D) Nicking at 23RSS divided by nicking at the suboptimal RSS (y axis) was normalized to that of the cc RAG complex, which was arbitrarily set to 1. The P values from the t test for the data were substantially greater than 0.1. (E) Histogram comparing sequence discrimination at nicking step and hairpin step by ff RAG complex. The amounts of nick (N) or hairpin (HP) product at optimal 12RSS and 23RSS sites were divided by those at SIL (left) or SCL (right) (y axes). The P values from the t test are listed under the histograms.

