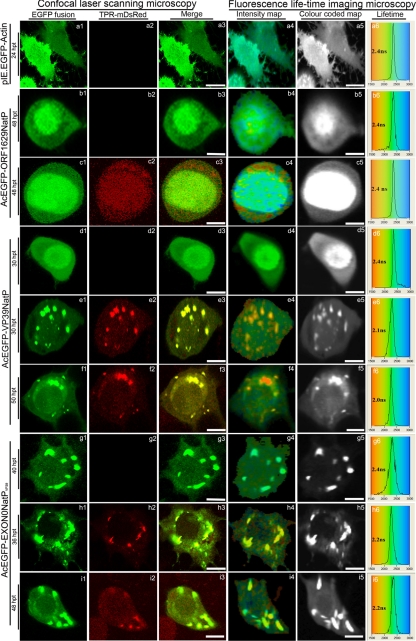
Fig 4.
Confocal microscopy and fluorescence lifetime imaging microscopy analysis of transfected TN-368 cells: (a1 to a6) Expression of only EGFP-actin (pIE.EGFP-Actin) and the expression of EGFP-Orf1629 (AcEGFP-Orf1629NatP), EGFP-VP39 (AcEGFP-VP39NatP), and EGFP-EXON (AcEGFP-VP39NatPVP39) are shown in b1 to b6, d1 to d6, and g1 to g6, respectively, as unquenched, negative controls. Transfected cells show expressions EGFP-ORF1629 and KLC-TPR-mDsRed (c1 to c6), EGFP-VP39 and KLC-TPR-mDsRed (e1 to e6 at 36 hpt and f1 to f6 at 50 hpt), and EGFP-EXON0 and KLC-TPR-mDsRed (h1 to h6 at 36 hpt and i1 to i6 at 48 hpt). Colocalization of EGFP fusions and KLC-TPR-mDsRed (yellow) are shown in e3, f3, h3, and i3 and interaction of dual proteins in e5, f5, h5, and i5. The lifetime panels show the distribution curves of the relative occurrence frequency of the lifetimes. The distribution curves of a6, b6, d6, and g6 show the lifetimes of only EGFP fusions with observed lifetimes of ∼ 2.4 ns. Transfected cells (c6) showing expression of both EGFP-Orf1629 and KLC-TPR-mDsRed indicated an observed lifetime of ∼2.4 ns, whereas lower values of interaction are distributed from 1.5 to 2.2 ns. All the images were processed with Adobe Photoshop (CS2). Bar, 15 μm.

