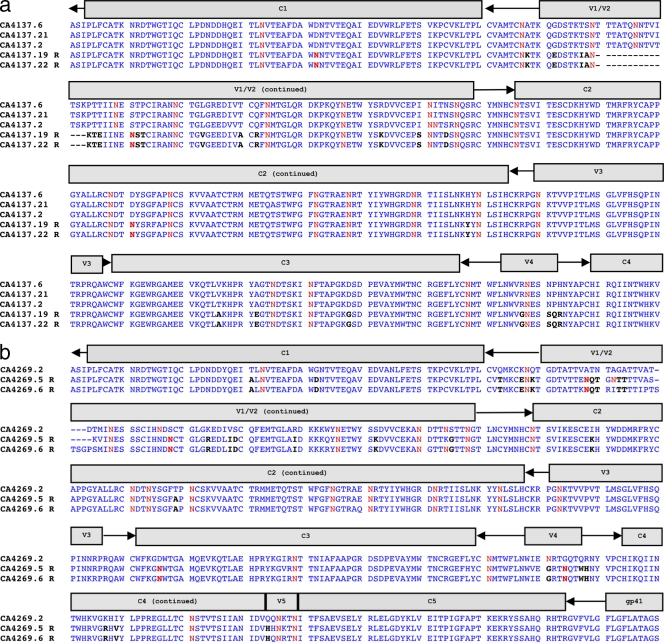
Fig 6.
Alignments from two subjects (a and b) demonstrating amino acid changes specific to resistant envelopes (R). Either additional or shifted potential N-linked glycosylation sites are highlighted in bold red, and other changes are in black. Only regions with differences between resistant and sensitive envelopes are displayed for each subject.

