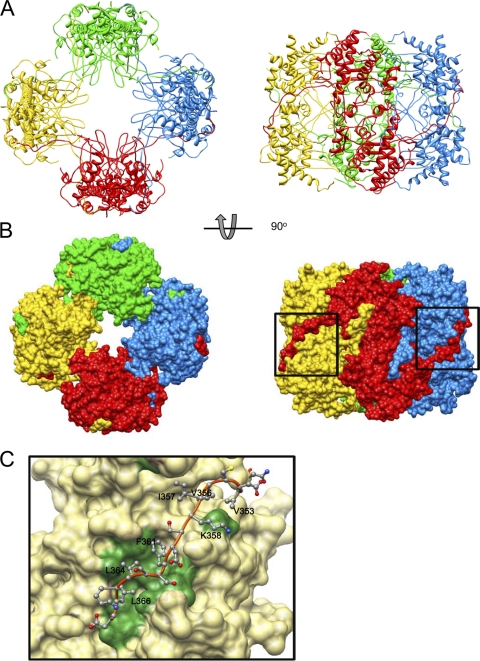
Fig 4.
Structure of the P9-1 octamer. (A) Ribbon diagram of the P9-1 octamer. (B) Molecular surface model. The diagrams in the right column were generated after rotation of the left images by 90°. Each dimer is shown in one of four colors. (C) Dimer-dimer interface. The C arm of P9-1 is shown by a ribbon, and side chains involved in intermolecular interaction are shown as ball-and-stick models. The neighboring dimer is shown as a molecular surface model, and regions of intermolecular interaction are colored green. Numbers of some residues are labeled to facilitate identification.

