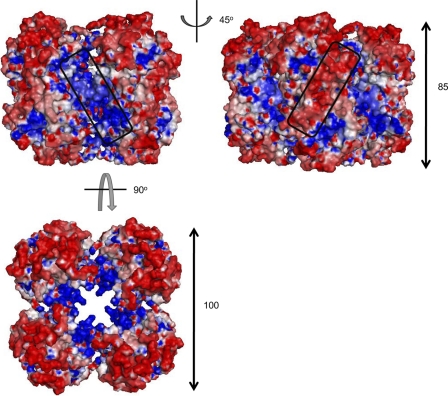
Fig 6.
Surface electrostatic potential on the P9-1 octamer. The side surface of the octamer is shown as a molecular surface model. The diagram in the right column was generated after rotation of the left image by 45°. Positively and negatively charged regions are colored blue and red, respectively. Clusters of positive and negative charge are indicated by boxes. The third diagram (below the first two) was generated after rotation of the left image by 90°.

