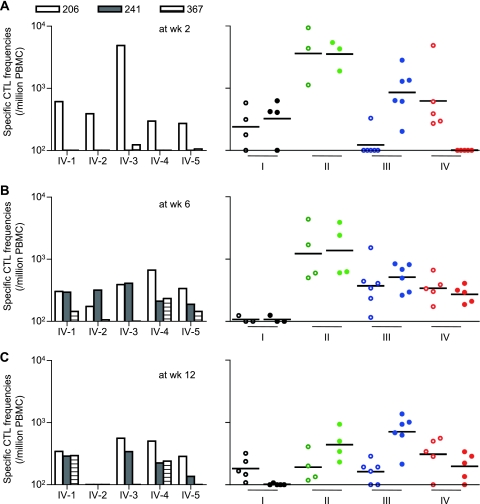
Fig 4.
Gag206-216-specific and Gag241-249-specific CTL responses after SIVmac239 challenge. CTL responses at week 2 (A), week 6 (B), and week 12 (C) are shown. In the graphs on the left, Gag206-216-specific (open boxes), Gag241-249-specific (closed boxes), and Gag367-381-specific (striped boxes) CD8+ T-cell frequencies in group IV macaques are shown. On the right, Gag206-216-specific (open circles) and Gag241-249-specific (closed circles) CD8+ T-cell frequencies in group I (black), II (green), III (blue), and IV (red) macaques are shown. The bars indicate the geometric mean of each group. Samples from macaques I-1, I-6, II-1, and II-3 at week 2; macaques I-1, I-2, I-6, and II-5 at week 6; and macaques I-1 and II-5 at week 12 were unavailable for this analysis. Statistical analyses among four groups at week 12 revealed significant differences in Gag241-249-specific CTL levels (I and III, P < 0.0001; I and II, and III and IV, P < 0.01; I and IV, II and III, and II and IV, P > 0.05 by one-way ANOVA and Tukey-Kramer's multiple-comparison test) but not in Gag206-216-specific CTL levels (P > 0.05 by one-way ANOVA).

