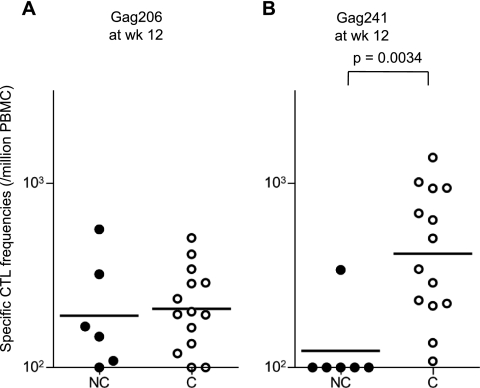
Fig 5.
Comparison of Gag206-216-specific or Gag241-249-specific CTL responses in noncontrollers and controllers at week 12. (A) Gag206-216-specific CD8+ T-cell frequencies in noncontrollers (NC; closed circles) and controllers (C; open circles). (B) Gag241-249-specific CD8+ T-cell frequencies in noncontrollers and controllers. Gag241-249-specific CTL levels in controllers were significantly higher than those in noncontrollers (P = 0.0034 by Mann-Whitney test). The bars indicate the geometric mean of each group. Data on a noncontroller (I-1) and a controller (II-5) were unavailable.

