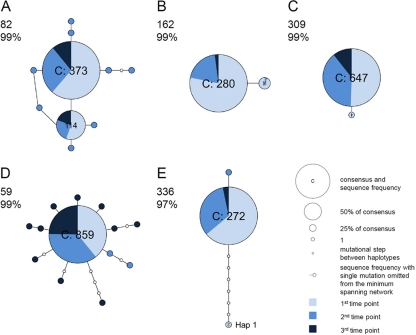
Fig 1.
Minimum spanning networks of intrahost DENV-1 sequence data (VP data set). Each network was inferred by compiling sequences from multiple days. The number in the upper left corner of each panel corresponds to the patient number; percentages indicate the probability of parsimony used to construct the network. Haplotypes with the high ancestral probability are displayed as circles. Circle sizes are proportional to the number of sequences that exhibit each variant, and the pie chart in each circle indicate the percentage of each variant at different time points. Connecting lines indicate a single mutation shared among haplotypes. (A and B) Minimum spanning network in which multiple viral lineages were observed across time points (patients 82 and 162). (C) Minimum spanning network in which one mutation was shared between haplotypes (patient 309). (D) Minimum spanning network with star-like typology (patient 59). (E) Minimum spanning network with reduced parsimony probability (patient 336).

