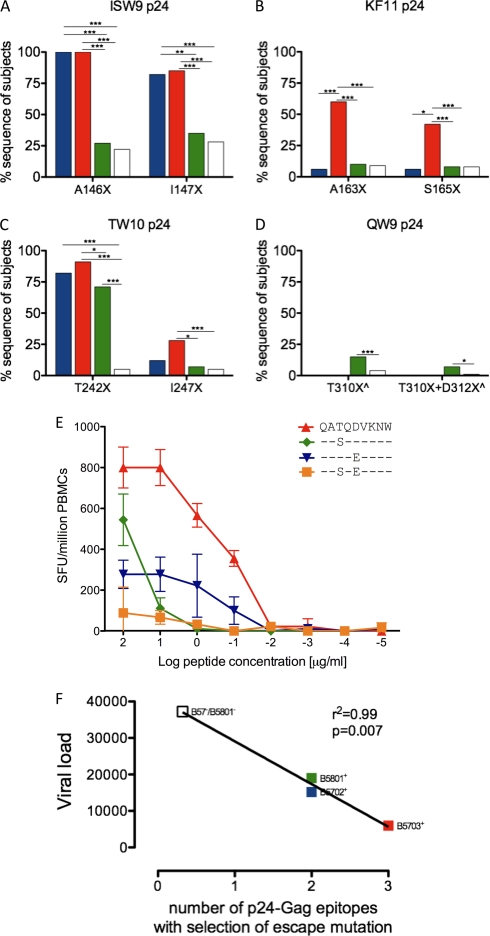
Fig 3.
Selection of escape mutations within 4 p24 capsid Gag epitopes. (A to D) Sequence polymorphisms indicated as percent sequences of subjects on the y axis, with the particular polymorphism shown on the x axis for ISW9, KF11, TW10, and QW9 p24 epitopes. HLA expression is color coded as in Fig. 2: B*5702+/B*5703−/B*5801−, n = 17 (blue); B*5703+/B*5702−/B*5801−, n = 54 (red); B*5801+/B*5703−/B*5702−, n = 142 (green); and B*5702−/B*5703−/B*5801−, n = 989 (white). (E) IFN-γ ELISPOT responses for recognition of QW9 QATQDVKNW wild type (WT) and escape peptides, shown as spot-forming units/million PBMCs against log peptide titrations (μg/ml) in donor N067 (HLA-A*0201/0205, B*5101/5801, and Cw*0701/1602). ^ indicates HLA-B*4403 individuals removed from analysis due to selection of B*4403-restricted escape mutations. (F) Correlation of the viral-load set point with the number of p24-Gag epitopes with selection of escape mutations. (A to D) Significant P values are indicated as follows: ***, P < 0.0001; **, P < 0.001; *, P < 0.01 (Fisher's exact test).

