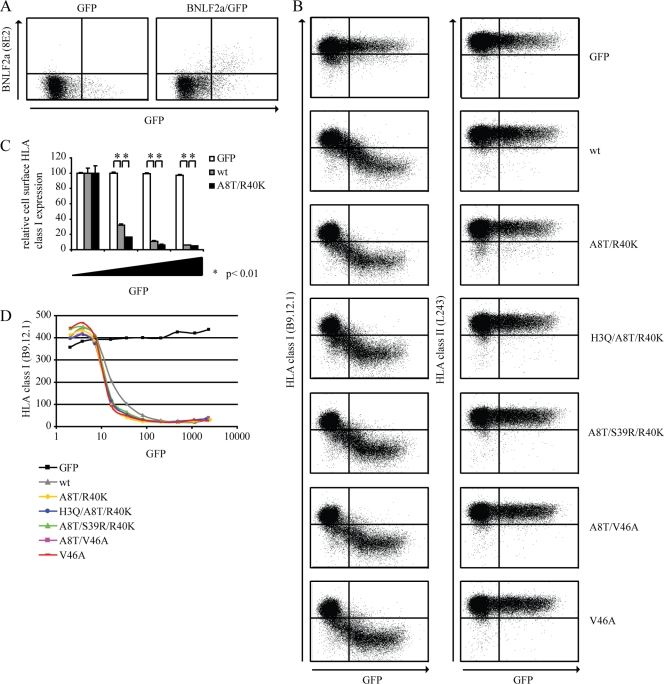
Fig 1.
EBV isolates retain BNLF2a-mediated HLA I downregulation. (A) MJS cells were transiently transfected to express the control protein GFP or to coexpress wild-type BNLF2a and GFP. After 48 h, cells were stained for intracellular expression of BNLF2a (monoclonal antibody [MAb] 8E2). Subsequently, the cells were analyzed by flow cytometry using CellQuest Pro software (BD Biosciences). (B) MJS cells were transiently transfected to express the control protein GFP, wild-type BNLF2a (wt), or one of the following BNLF2a mutants: A8T/R40K, H3Q/A8T/R40K, A8T/S39R/R40K, A8T/V46A, or V46A. After 48 h, cells were stained for cell surface expression of HLA I (MAb B9.12.1) and HLA II (MAb L243) and analyzed by flow cytometry using CellQuest Pro software (BD Biosciences). (C) Quantification of flow cytometry data. Cell surface expression levels of HLA I were correlated with GFP expression for cells transfected to express the control protein GFP, wild-type (wt) BNLF2a, or the A8T/R40K BNLF2a mutant. To this end, values were corrected for cell surface expression of HLA I in GFP-negative cells. The standard deviations are represented by the error bars. *, P < 0.01 as determined by a t test. (D) Graphical display of the results shown in panel B. The mean fluorescence index of HLA I expression is plotted against the mean fluorescence index of GFP expression. The results of one representative experiment out of at least three independent experiments are shown. For panel A, the experiment was performed in duplicate.

