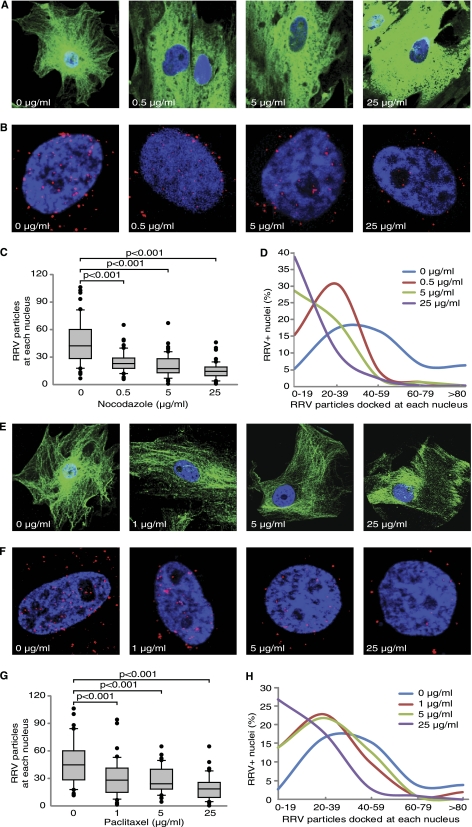
Fig 1.
Disruption of microtubule networks with nocodazole or inhibition of microtubule dynamics with paclitaxel blocks RRV trafficking in RFs. (A and E) Effect of nocodazole and paclitaxel on microtubule networks. RFs were treated with increasing concentrations of nocodazole (A) or paclitaxel (E) and stained with an anti-β-tubulin antibody. Microtubule networks were disrupted by nocodazole but stabilized by paclitaxel. (B and F) Effect of nocodazole and paclitaxel on RRV trafficking. RFs were treated with nocodazole (B) or paclitaxel (F) for 1 h and inoculated with RRV in the presence of inhibitors, fixed at 4 h postinfection (hpi), and stained for RRV particles (red) and nuclei (blue). (C and G) Quantification of the total numbers of RRV particles docked at each nucleus following treatment with nocodazole (C) or paclitaxel (G). Images were acquired for 6 to 10 fields per coverslip to allow counting of 50 nuclei. The t test, analysis of variance, and/or Mann-Whitney tests were performed using SigmaPlot 11.0 (Systat Software, Inc., San Jose, CA) with P < 0.05 considered significant. The numbers of RRV particles docking on a nucleus upon drug or control treatment are presented in box and whisker plots showing the median values (middle dark lines in the boxes) and the upper 75% and lower 25% quartiles (top and bottom box lines of the open boxes). The top and bottom short lines showed the ranges of the data, and outliers were represented as black dots. All experiments were performed in triplicates. (D and H) Distribution of nuclei with different numbers of RRV particles following treatment with nocodazole (D) or paclitaxel (H).

