Fig 4.
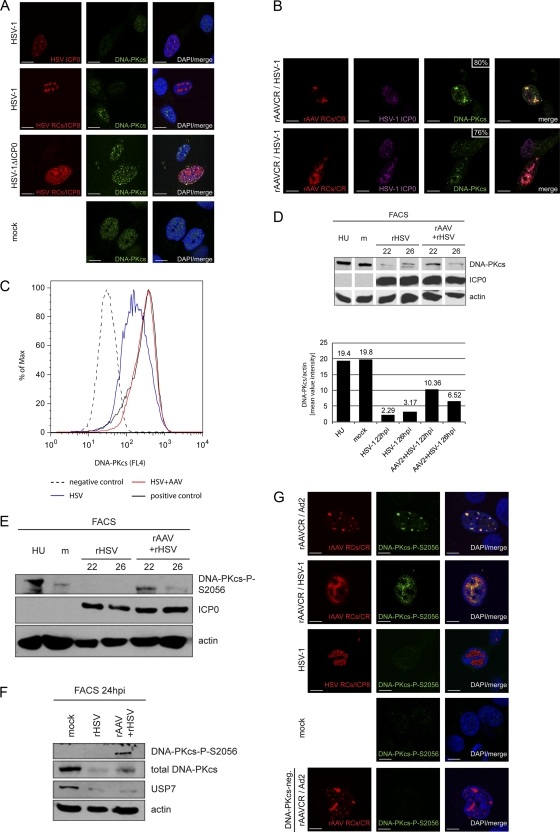
Activation and delayed degradation of DNA-PKcs in cells coinfected with HSV-1 and AAV2. (A) MO59J Fus1 cells were infected with HSV-1 (MOI, 1.5) or HSV-1ΔICP0 (MOI, 0.9) or mock infected. After 24 h, cells were fixed and processed for IF analysis. HSV-1 infection was detected using an antibody specific for ICP0 or ICP8 and an AF594-labeled secondary antibody (red). Additionally, cells were stained with an antibody specific for DNA-PKcs and an FITC-labeled secondary antibody (green). DAPI was used to stain cellular DNA. Scale bars, 10 μm. (B) IF analysis of MO59J Fus1 cells at 24 h after coinfection with rAAVCR (MOI, 250) and HSV-1 (MOI, 1.5). rAAVCR RCs (red) were visualized as described in the legend to Fig. 2. Additionally, cells were stained with antibodies specific for ICP0 or ICP8 and an AF405-labeled secondary antibody (purple) and with an antibody specific for DNA-PKcs and an FITC-labeled secondary antibody (green). The percentage of DNA-PKcs in rAAVCR RCs is indicated. Scale bars, 10 μm. (C) Flow cytometric analysis of infected cells. DNA-PKcs-positive HCT116 cells were mock infected (positive control), infected with rHSV-1ICP4EYFP (MOI, 1.5), or coinfected with HSV-1 (MOI, 1.5), AAV2 (MOI, 250), and rAAVGFP (MOI, 250). HCT116 cells negative for DNA-PKcs served as a negative control. Cells were fixed at 20 h postinfection and stained with a DNA-PKcs-specific monoclonal antibody and a Cy5-labeled secondary antibody. DNA-PKcs was analyzed in HSV-1-infected cells positive for EYFP-ICP4 (HSV) and in coinfected cells positive for EGFP (HSV+AAV). A minimum of 80,000 events were scored for each sample. Graphs were overlaid to show the fluorescence shift of HSV-1-infected populations. (D and E) WB analysis of AT22 IJE-T cells sorted for productive HSV-1 and AAV2 infection at 22 and 26 hpi. Cells were mock infected, infected with rHSV-1vECFP-ICP4 (rHSV; MOI, 2), or coinfected (rHSV + rAAV) with rHSV-1vECFP-ICP4 (MOI, 2) and rAAV2CR (MOI, 4,000). Lysates of sorted cells were processed for WB analysis and stained with the antibodies indicated. Quantification of WB band intensities was done with a Gel Doc system using Quantity One software (version 4.6.1; Bio-Rad, Hercules, CA). (F) WB analysis of AT22 IJE-T cells sorted for productive HSV-1 and AAV2 infection at 24 hpi. Cells were mock infected, infected with rHSV-1vECFP-ICP4 (rHSV; MOI, 4), or coinfected (rHSV + rAAV) with rHSV-1vECFP-ICP4 (MOI, 4) and rAAV2CR (MOI, 4,000). Lysates of sorted cells were processed for WB analysis and stained with the antibodies indicated. (G) MO59J Fus1 cells were mock infected, infected with HSV-1 (MOI, 1.5), or coinfected with rAAVCR (MOI, 250) and either HSV-1 (MOI, 1.5) or Ad2 (MOI, 12.5). After 24 h, cells were fixed and processed for IF analysis. rAAVCR and HSV-1 RCs (red) were visualized as described in the legend to Fig. 2. DNA-PKcs phosphorylation was detected with an antibody specific for DNA-PKcs-P-S2056 and an FITC-labeled secondary antibody (green). As a negative control, MO59J Fus9 DNA-PKcs-negative cells were coinfected with rAAVCR (MOI, 250) and Ad2 (MOI, 12.5) and stained for pDNA-PKcs. DAPI was used to stain cellular DNA. Scale bars, 10 μm.

