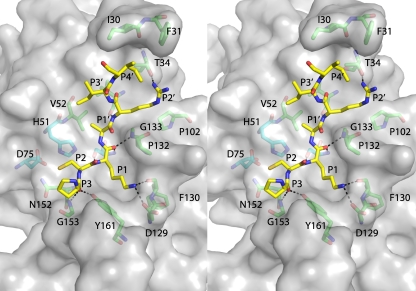
Fig 5.
Detailed view of interactions between DENV-3 protease and aprotinin. Stereo diagram of the P3′-P4 residues of aprotinin (shown as yellow sticks) on the surface of the DENV-3 protease (gray). Potential hydrogen bonds are indicated by dashed lines. Other residues lining the pocket are shown as green sticks, with the catalytic triad shown as blue sticks.

