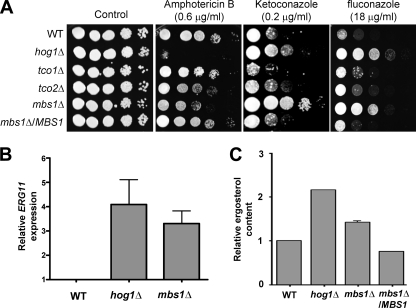
Fig 4.
Role of Mbs1 in antifungal drug susceptibility and ergosterol biosynthesis. (A) Each C. neoformans strain described in Fig. 3B was grown overnight at 30°C in liquid YPD medium, 10-fold serially diluted (1 to 104 dilutions), and spotted (3 μl of dilution) on YPD agar containing the indicated concentrations of amphotericin B, ketoconazole, and fluconazole. (B) Quantitative RT-PCR showing transcript levels of ERG11 in the WT strain and hog1Δ and mbs1Δ mutants. For qRT-PCR, MBS1 expression data obtained from three independent biological replicates with three technical replicates were normalized by using ACT1 as a control. Relative gene expression indicates ERG11 expression levels normalized to those of the WT strain. (C) Cellular ergosterol content was measured as described in Materials and Methods. The graph demonstrates relative increase in ergosterol content compared to WT. Each bar demonstrates the average from four independent experiments, and error bars indicate the standard deviation.

