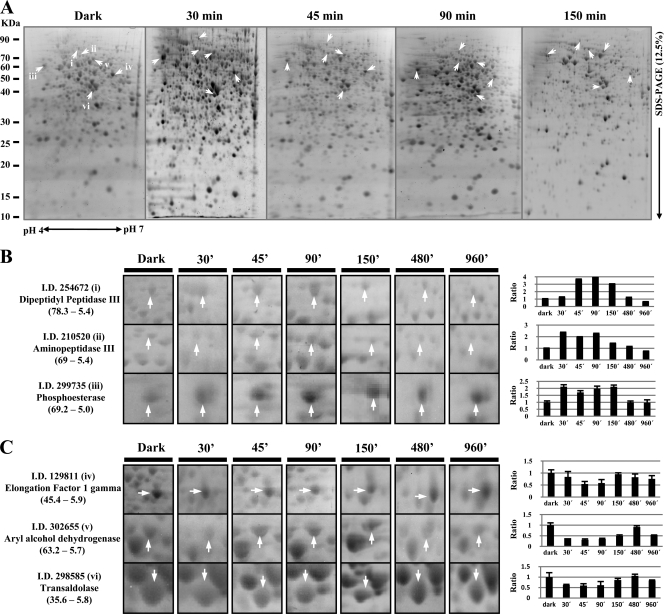
Fig 1.
2-DE proteome analyses of T. atroviride strains subjected to a blue light pulse. (A) Total protein profiles. Proteins extracted from T. atroviride grown in the dark and 30, 45, 90, and 150 min after a light pulse were separated by 2-DE and visualized with Sypro Ruby stain. (B and C) Close-ups of several increased spots (B) and decreased spots (C) after the blue light pulse (from left to right, dark conditions and 30, 45, 90, 150, 480, and 960 min after the light pulse). The right panels show relative abundances in terms of the fold change of each spot in the gel (x axis, sampling time; y axis, fold change). Arrows indicate the proteins expressed differentially in response to blue light. Ratio, relationship between treatment and dark control protein levels. Numbers in parentheses indicate the molecular weight and isoelectric point, respectively.

