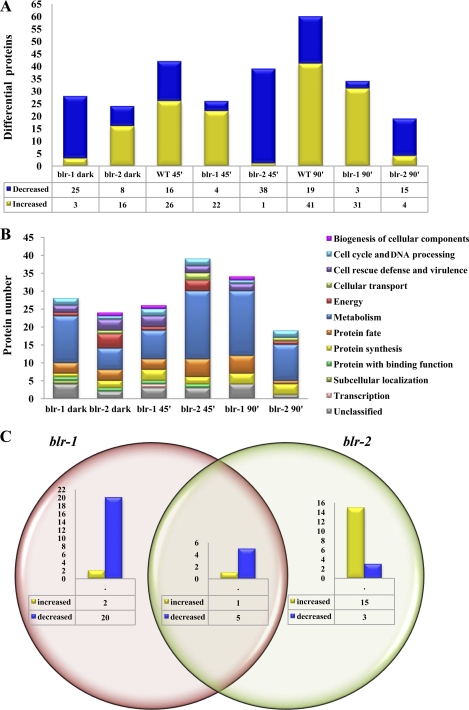
Fig 4.
Proteomic profiling of photoreceptor complex mutants of T. atroviride compared with the wild type in the dark and after a blue light pulse. (A) Differentially expressed proteins in the Δblr-1 and Δblr-2 mutants in the dark compared with the wild-type strain in the dark and differentially expressed proteins after a blue light pulse in the WT, Δblr-1, and Δblr-2 strains compared with themselves in the dark. (B) Functional classification of identified proteins that showed a significantly altered protein level (>1.5-fold) after a blue light pulse in the Δblr-1 and Δblr-2 mutants, categorized according to the MIPS Functional Catalogue (FunCat description). (C) Venn diagram of differentially expressed proteins observed in the blr deletion mutants in the dark.

