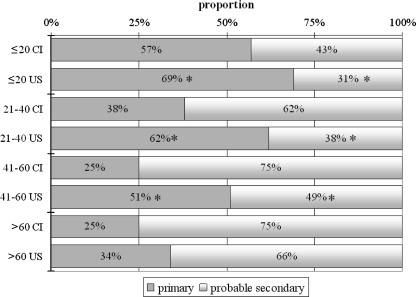
FIG 1.
Proportional distributions of primary and probable secondary DV infections within a given age category for each place of patient residence. Age categories (years) for Caribbean island (CI) and U.S. mainland (US) residents are indicated on the vertical axis. Asterisks indicate significant differences (P < 0.01) observed in pairwise comparisons of U.S. mainland residents and CI residents within a given age category.

