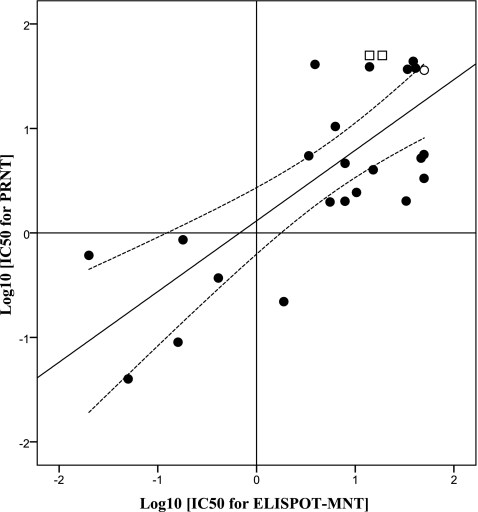
Fig 3.
Scatter plot of the IC50 values from PRNT and ELISPOT-MNT (log-log transformation). The middle line is the best fit to the data by linear regression (R2 = 0.555; P = 0.000); the dashed lines show the 95% confidence interval. The hollow square and circle are the false-positive and false-negative results compared to PRNT, taking the value >50 μg/ml as 50 μg/ml.

