Figure 3.
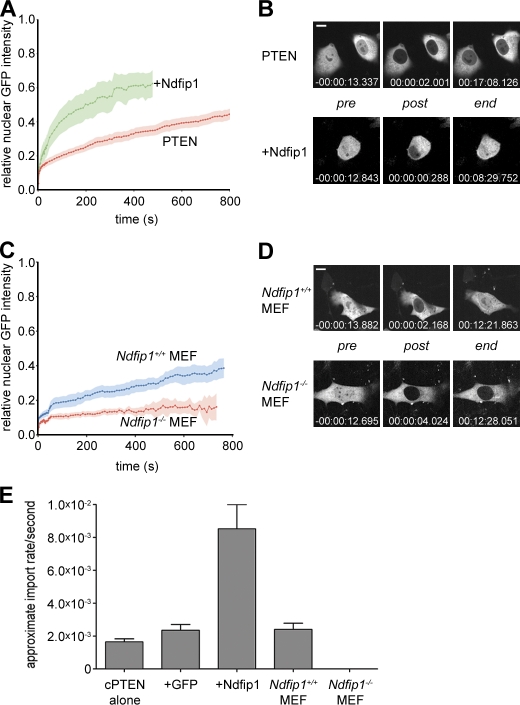
Ndfip1 regulates PTEN nuclear import. (A) Nuclear FRAP analysis of cherry-PTEN shows enhanced transport upon coexpression of Ndfip1-GFP after photobleaching. Errors (SEM) are shown as shaded areas. (B) Images of typical cells from A at pre- or postbleach times and at experimental end points. Relative time points are indicated. (C) Nuclear FRAP analysis of GFP-PTEN shows the absence of transport in Ndfip1−/− MEFs compared with Ndfip1+/+ MEFs. Errors (SEM) are shown as shaded areas. (D) Images of typical cells from C at pre- or postbleach times and at experimental end points. Relative time points are indicated. (B and D) Bars, 10 µm. (E) Quantification of FRAP analyses after expression of cherry-PTEN (cPTEN) alone, with GFP (+GFP) or Ndfip1-GFP (+Ndfip1), or in the indicated cell type (cPTEN, n = 11; GFP, n = 4; Ndfip1, n = 5; Ndfip1+/+ and Ndfip1−/− MEF experiments, n = 10). Values are mean ± SEM.

