Figure 6.
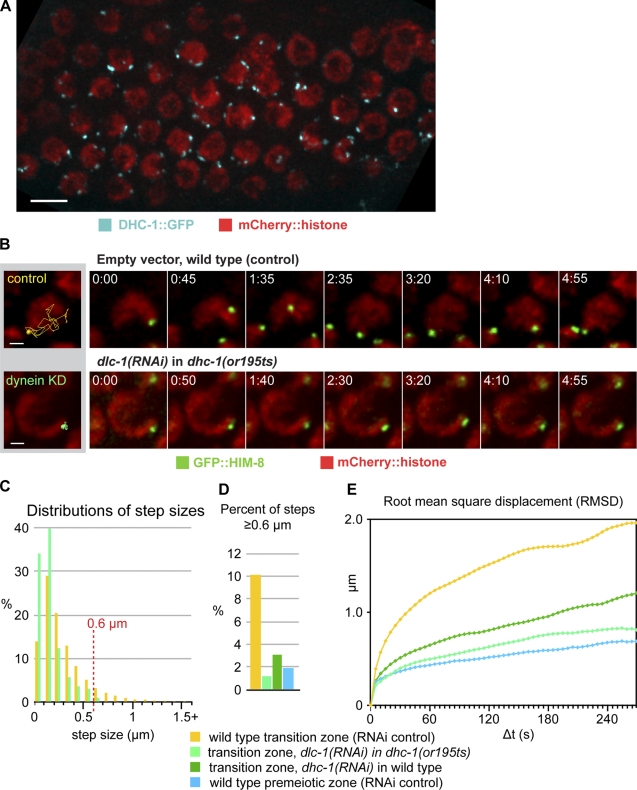
Dynein activity is required for PCMs. (A) Maximum intensity projection image from a recording of a hermaphrodite expressing DHC-1::GFP and mCherry::histone. Meiotic progression is from left to right; TZ nuclei show prominent dynein foci at the nuclear surface. Bar, 5 µm. (B) Selected projection images from a time series showing GFP::HIM-8 and mCherry::histone from single nuclei in the TZ of dynein knockdown (KD; dlc-1 RNAi in dhc-1(or195ts)) or WT control animals. (left) Tracks represent all steps over a 5-min data collection superimposed on a projection image from a single frame. Bars, 1 µm. (C) Distributions of step sizes in TZ nuclei from dynein knockdown (dlc-1 RNAi in dhc-1(or195ts)) animals compared with TZ nuclei of RNAi control animals (dynein knockdown [dlc-1 RNAi in dhc-1(or195ts)]: 2,599 steps, 45 trajectories, and 3 datasets; control RNAi: 2,588 steps, 45 trajectories, and 3 datasets). Bins = 0.1 µm. (D) Proportion of steps >0.6 µm under the indicated conditions; data from WT premeiotic nuclei are shown for comparison (dynein knockdown [dhc-1 RNAi 30 h]: 2,396 steps, 40 trajectories, and 3 datasets). (E) RMSD plots for all trajectories. Colors correspond to those in D.

