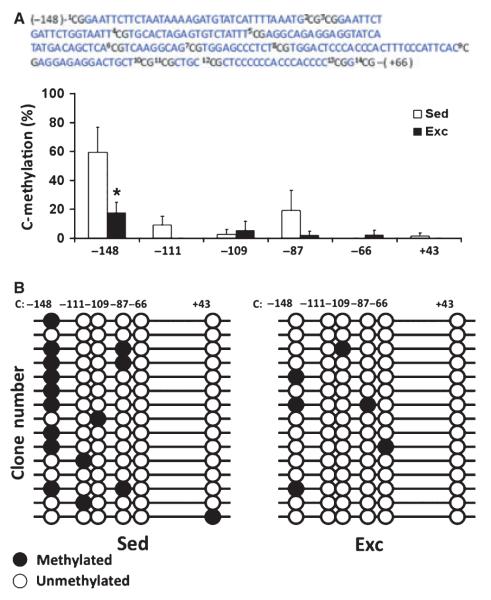
Fig. 1.
Exercise reduced DNA methylation of Bdnf exon IV promoter in rat hippocampus. (A) The bar graph shows the DNA methylation levels of exercised (Exc) and sedentary (Sed) control animals on six CpG sites. Bisulfite sequencing analysis showed that the DNA methylation level was less in animals exposed to exercise, the −148 CpG site showing the most dramatic DNA demethylation. (B) The number on top of the diagram labels the position of CpG sites relative to the transcription starting site (+1), and each horizontal line represents the result for one clone (open circles, unmethylated CpGs; filled circles, methylated CpGs). The DNA methylation level was calculated by the number of methylated CpGs divided by the total number of CpGs analyzed. Values represent the mean + SEM; *P < 0.05; n =4/group.

