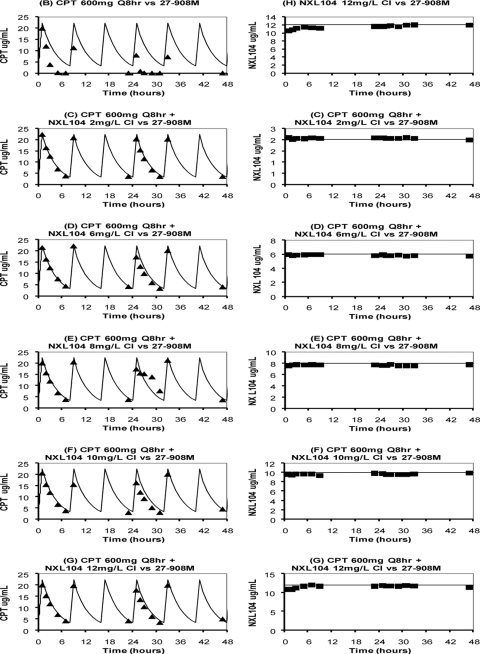
Fig 4.
Pharmacokinetic profiles for the second dose-ranging hollow-fiber experiment (for K. pneumoniae 27-908M only). Targeted (solid curves) and measured concentration-time profiles for ceftaroline (triangles) and NXL104 (squares) in hollow-fiber systems are shown. For experimental arms that received both drugs (arms C to G), the PK profiles for each drug are shown in separate graphs for clarity. The bacterial suspension was washed to remove preformed β-lactamases before it was inoculated into hollow-fiber systems. Arm A is not shown because this arm was the nontreatment control for K. pneumoniae 27-908M. CPT, ceftaroline; CI, continuous infusion.

