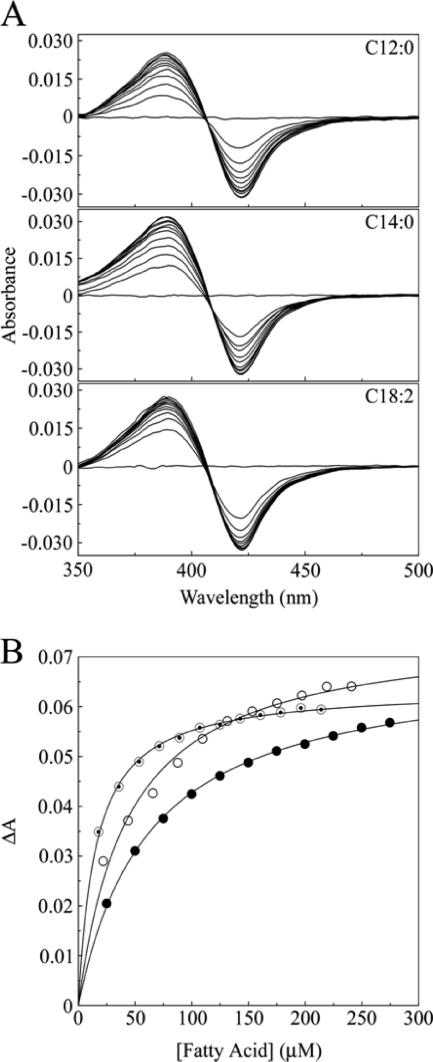
Fig 4.
Fatty acid binding to CYP164A2. (A) UV-Vis difference spectra were determined by the progressive titration of lauric (C12:0), myristic (C14:0), and linoleic (C18:2) acids against 3 μM CYP164A2 in 50 mM Tris-HCl (pH 8.6)–25% (wt/vol) glycerol. (B) Fatty acid binding saturation curves for lauric (filled circles), myristic (hollow circles), and linoleic (bullets) acids were constructed from the UV-Vis difference spectra. Data sets were fitted by using the Michaelis-Menten equation to derive Ks values for each fatty acid.

