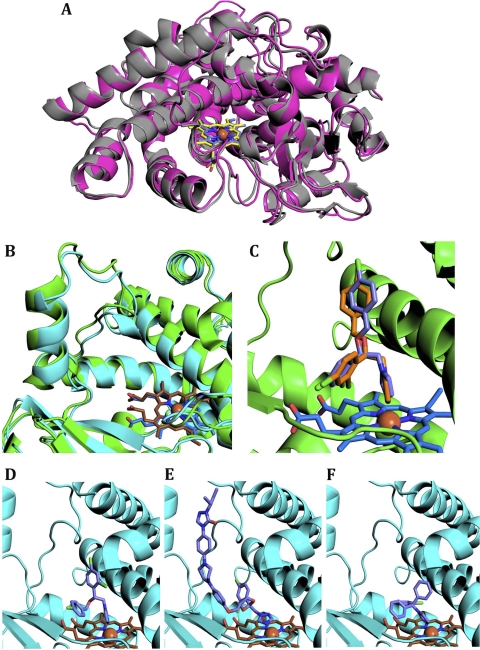
Fig 5.
Structural modeling of M. leprae CYP164A1 complexes with azole inhibitors. (A) Cartoon overlay of CYP164A2 (colored as described in the legend of Fig. 1) and CYP164A1 in open states. The CYP164A1 model is shown in magenta, and the heme is shown in purple. (B) Overlay of the BC loop of the CYP164A1 inhibitor complex model (protein in cyan and heme in brown) on the crystal structure of the econazole-CYP164A2 complex (as described in the legend of Fig. 1). (C) Overlay of econazole docked into the CYP164A1 complex model onto the crystal structure of the econazole-CYP164A2 (closed) complex. The crystal structure is colored as described above. The top docking simulation conformation is represented in purple. (D, E, and F) The azole inhibitors bound to the active site of the closed-conformation CYP164A1 model. The inhibitors depicted are econazole (D), itraconazole (E), and clotrimazole (F).

